Stats Series | Statistical Jargon Decoded: A Plain Language Breakdown of the Statistics Behing the Findings

When it comes to reporting evaluation findings, I allocate a significant amount of time to making sure statistical results are translated from technical language into plain English.
To me, this is the most important step to ensure that evaluation findings can truly be useful for program managers and school administrators. A report full of technical language can seem official on the surface, but it will not hold anyone's attention past the first two or three pages if it does not explain what those concepts mean and, more importantly, what they mean for the program and the decisions that follow.
If you have come across evaluation reports from your district's research office, a university partner, or an external evaluator, you might remember running into words like "statistically significant," "effect size," and/or "confidence interval." If you work in federal education programs, you are likely familiar with the ESSA (Every Student Succeeds Act) levels of evidence framework, which classifies programs and interventions based on the strength of the research behind them. That framework is built entirely on statistical concepts; the ESSA levels of evidence are based on whether the study had a comparison group, whether participants were randomly assigned, whether results were statistically significant, and how large the effect was. All these examples illustrate that many people recognize these words, but understanding what they mean is a different story.
As part of my Stats Series, I am going to describe some of the most common concepts you need to understand to read an evaluation report with confidence. Make sure you save this one for future reference!
Major Concepts
Program Group, Comparison Group, and How People End Up in Each
A control group or comparison group is the set of people who did not receive the program during the evaluation period. They serve as the counterfactual: what would have happened to participants if they had not received the program? This grouping with a counterfactual is a core component of impact evaluation design.
How people are placed in the program group or the comparison group, is also important to know. The gold standard in research is the random assignment of people to each group, commonly known as a Randomized Controlled Trial (RCT). However, this practice is more complex to achieve in real-world education settings because random assignments raise logistical and ethical challenges; it can be difficult to withhold a potentially beneficial program from students who need it, and school operations do not always allow for controlled group formation.
For this reason, educational programs are most often evaluated during implementation or after the fact, so evaluators identify the students who received the program or intervention and match them to a group of students who did not. This approach, known as a quasi-experimental design, uses statistical methods to create a comparison group that resembles the program group as closely as possible. Think of it as building the best possible comparison with the data available, even without the ideal conditions of a randomized study. It is not the same as random assignment, but when done rigorously, it can produce credible evidence about a program's effect.
Sample size
Sample size is how many people were included in the study. Knowing the sample size is also important for two main reasons:
First, larger samples produce more stable estimates. A finding based on 20 students is much more likely to shift if you add five more students than a finding based on 2,000 students.
Second, sample size affects statistical significance, and some statistical tests are more sensitive to it than others. Very large samples can produce statistically significant results for differences that are trivially small in practice. Very small samples can miss real effects entirely.
All these does not mean that bigger sample sizes are always better or needed. The appropriate sample size depends on the program being evaluated and the statistical technique being used. There are free online resources for calculating sample size, but that is a conversation for you and your evaluator to have together. For now, the goal is simply to understand what sample size is and why it matters when reading evaluation findings.
Descriptive Statistics
Mean vs. Median
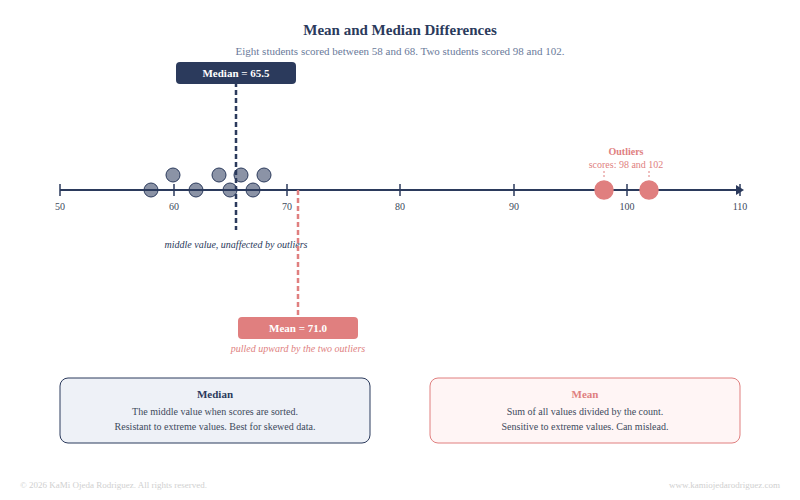
The mean is the average: add all the values together and divide by the number of observations. The median is the middle value when all observations are sorted from lowest to highest.
They tell different stories when the data is skewed. Imagine a program where nine students gained 5 points and one student gained 95 points. The mean gain is 14 points. The median gain is 5 points. The mean is pulled upward by that one outlier and no longer represents the typical student experience.
Variance
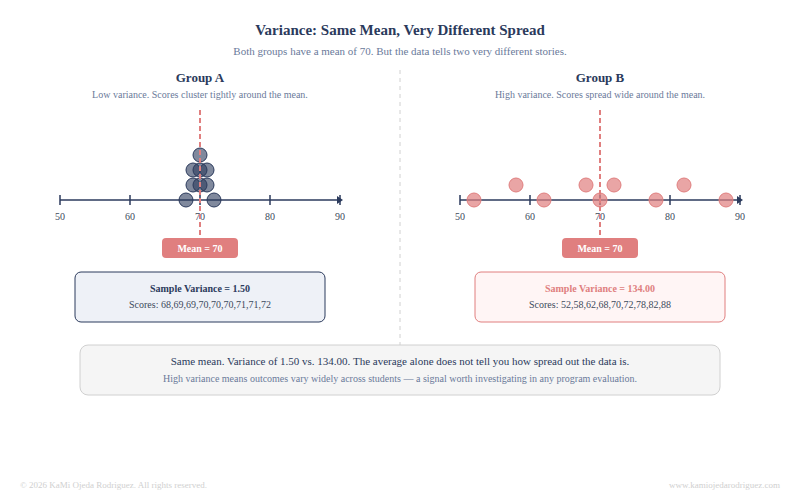
Variance describes how spread out the data is around the average. Two programs can have the same mean outcome and look completely different when you see the spread.
Variance is also a foundational concept in parametric statistical tests. Parametric tests are a family of statistical procedures that make assumptions about the distribution of the data, most commonly that the data follows a normal distribution and that variance is consistent across groups. Variance also matters because many statistical tests assume the data follows a predictable pattern, when variance is very unequal across groups, those tests may produce unreliable results. Understanding what variance is helps you understand what those tests are doing under the hood.
Related to Hypothesis Testing
Statistical significance
Statistical significance is one of the most used concepts in research and evaluation. When a result is described as statistically significant, it means the pattern found in the data is unlikely to be due to random chance. Statistical tests calculate the likelihood of observing the effect in the data and it is expressed as a p-value. If the p-value is small enough (less than 0.05 is the common threshold), then we conclude the result is statistically significant. If the p-value is above the 0.05 threshold, it means we do not have enough evidence to rule out chance as an explanation. The program might have an effect on the evaluated outcome, but considering the parameters of the study, there is no evidence to suggest that if there was an effect, it could be attributed to the program.
The 0.05 cutoff is a convention, not a law. It means the evaluator is willing to accept a 5 percent chance of being wrong when concluding a result is real. There are different scenarios in which a higher or lower cutoff point is used. In high-stakes decisions, some researchers even use a stricter threshold of 0.01. In exploratory work, 0.10 is sometimes acceptable.
Statistical significance alone does not provide much information, though. After a statistical test produces a small p-vale (0.05, 0.01, 0.001) there is a separate question that remains unanswered: what is the size of the effect?
Effect size
Effect size answers the question statistical significance cannot: how big is the difference, practically speaking? Different statistical tests use different effect size measures, and thresholds can also vary by field of study. For the purpose of this post, I am focusing on one widely used measure, but keep in mind there are others. The important lesson here is that significance alone will not tell you much. You also need to know the strength of that effect, reported as an effect size.
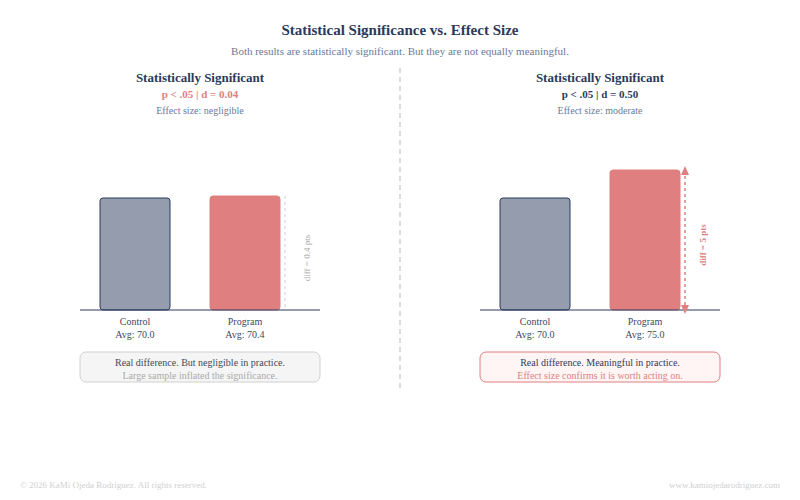
One common effect size measure is Cohen's d. As a rough guide: a d of 0.2 is considered small, 0.5 is moderate, and 0.8 or above is large. A program that produces a statistically significant result with a d of 0.04 shows a difference, but one that is negligible in practical terms. A program with a d of 0.5 produced a result worth paying attention to.
Now, it does not stop at the effect size, we also must look at one more step, statistical power.
Statistical power
Statistical power is the ability of a study to detect a real effect if one truly exists. The power is directly related to sample size. Remember that sample size depends on several factors, including the study design and the statistical test being used. So having an adequate sample size is essential for achieving sufficient statistical power. If results appear significant with a moderate effect size but the study had low statistical power, those findings should be interpreted with caution. The signal may not be as reliable as it appears. Think of it like a radio signal: a powerful receiver picks up faint signals clearly, while a weak receiver misses them entirely. A low-powered study is the weak receiver.
A study with low power might miss a genuine program effect simply because it did not have enough participants or enough variability in the data to pick up the signal. When an evaluation finds no significant effect, it is worth asking whether the study had adequate power to detect one. A null finding from an underpowered study is not the same as evidence that the program did not work.
Confidence interval
A confidence interval gives you a range around the estimate rather than a single number. For example, instead of saying the program produced a gain of 5 points, a 95 percent confidence interval might say the true gain is somewhere between 2 and 8 points.
That range reflects the uncertainty in the estimate: a narrow interval means the estimate is precise while a wide interval means there is more uncertainty in the result, and the single number in the headline should be interpreted with that in mind. Now, if the confidence interval includes zero, the result is not statistically significant. This is an important caveat to be familiar with when reading evaluation reports.
Regression coefficient
A regression coefficient describes the relationship between two variables after accounting for other factors in the model. In plain terms: for every one unit increase in X, the outcome changes by this amount, holding everything else constant.
For example, a coefficient of 3.2 on a program participation variable might mean that students who participated scored 3.2 points higher on average than comparable students who did not, after controlling for prior achievement, attendance, and grade level.
The key phrase is "after controlling for." That is what makes regression more useful than a simple comparison, because it adjusts for the differences between groups that could otherwise distort the finding. When thinking about 'after controlling for,' it helps to understand it this way: as evaluators, when we control for something, we are trying to rule out other potential explanations for the observed effect, in an attempt to isolate the program's contribution. So for example, if I am evaluating the impact of a tutoring program, some potential explanations could be: “well, the student did not improve much because of limited English proficiency, or the student improved significantly because they are gifted, not because of the program.” Every time we identify a potential reason a student could do better or worse due to an alternative explanation unrelated to the program, that is when we control. The regression accounts for all of these factors, which yields a cleaner, more isolated view of the program's effect on the outcome.
Reliability
Reliability refers to the consistency of a measure. A reliable measure produces similar results under similar conditions. If you step on a scale three times in a row and get three very different numbers, it means the scale is not reliable. In program evaluation, unreliable measures add noise to the data. That noise makes it harder to detect real effects. If the tool used to measure the outcome is inconsistent, even a well-designed evaluation will struggle to produce interpretable findings. Reliability is a necessary condition for good measurement but it is not sufficient on its own because a measure can be perfectly consistent and still measure the wrong thing.
Validity
Validity is the most important question: Does the measure capture what it claims to capture?
A scale that consistently reads ten pounds too heavy is reliable but not valid. It produces consistent results that do not reflect reality. In evaluation, a measure of student engagement that only tracks attendance is reliable, but if engagement means something deeper than showing up, the measure lacks validity. Validity questions are often the most important ones to ask about any evaluation. If the measure does not capture the construct it is supposed to represent, the findings answer the wrong question, regardless of how sophisticated the analysis is.
What statistics cannot tell you?
Statistics are powerful, but because they have limits it is important to be clear about those limits honestly.
Statistics can tell you whether a pattern exists and how strong it is but they cannot tell you why the pattern occurred.
A regression model can show that students who participated in a program scored higher than comparable students who did not. It cannot tell you which specific element of the program drove that result.
Statistics cannot tell you whether a finding will hold in a different context. A program that worked in one district may not work the same way in another with different demographics, resources, or implementation conditions.
Statistics cannot tell you whether a program is worth continuing. That is a judgment call that requires evidence plus context: the cost, the alternatives, the priorities of the community, and the quality of the implementation.
The bottom line
The goal with this post was to help program managers and administrators become informed consumers of evaluation. To do this, you do not need a strong background in statistics, all you need is familiarity with the language to know what questions to ask and how to use the information being presented to you. Statistical literacy is being able to read findings critically and feel confident asking the right follow-up questions.
That is what evaluation literacy looks like in practice, and it is a skill anyone can build.