If Everything Is a Priority, Nothing Is: The Importance of Choosing the Right Survey Response Scale
One of the components of all ESEA federal grants is the requirement to consult stakeholders in the identification and prioritization of the use of funds. As I was working on designing data collection processes to collect stakeholder input, I followed the same process I follow when creating tools, designing evaluation plans and creating key performance indicators: I research about what has been already done – just like graduate school trains us because there is a lot of value in looking at previous work.
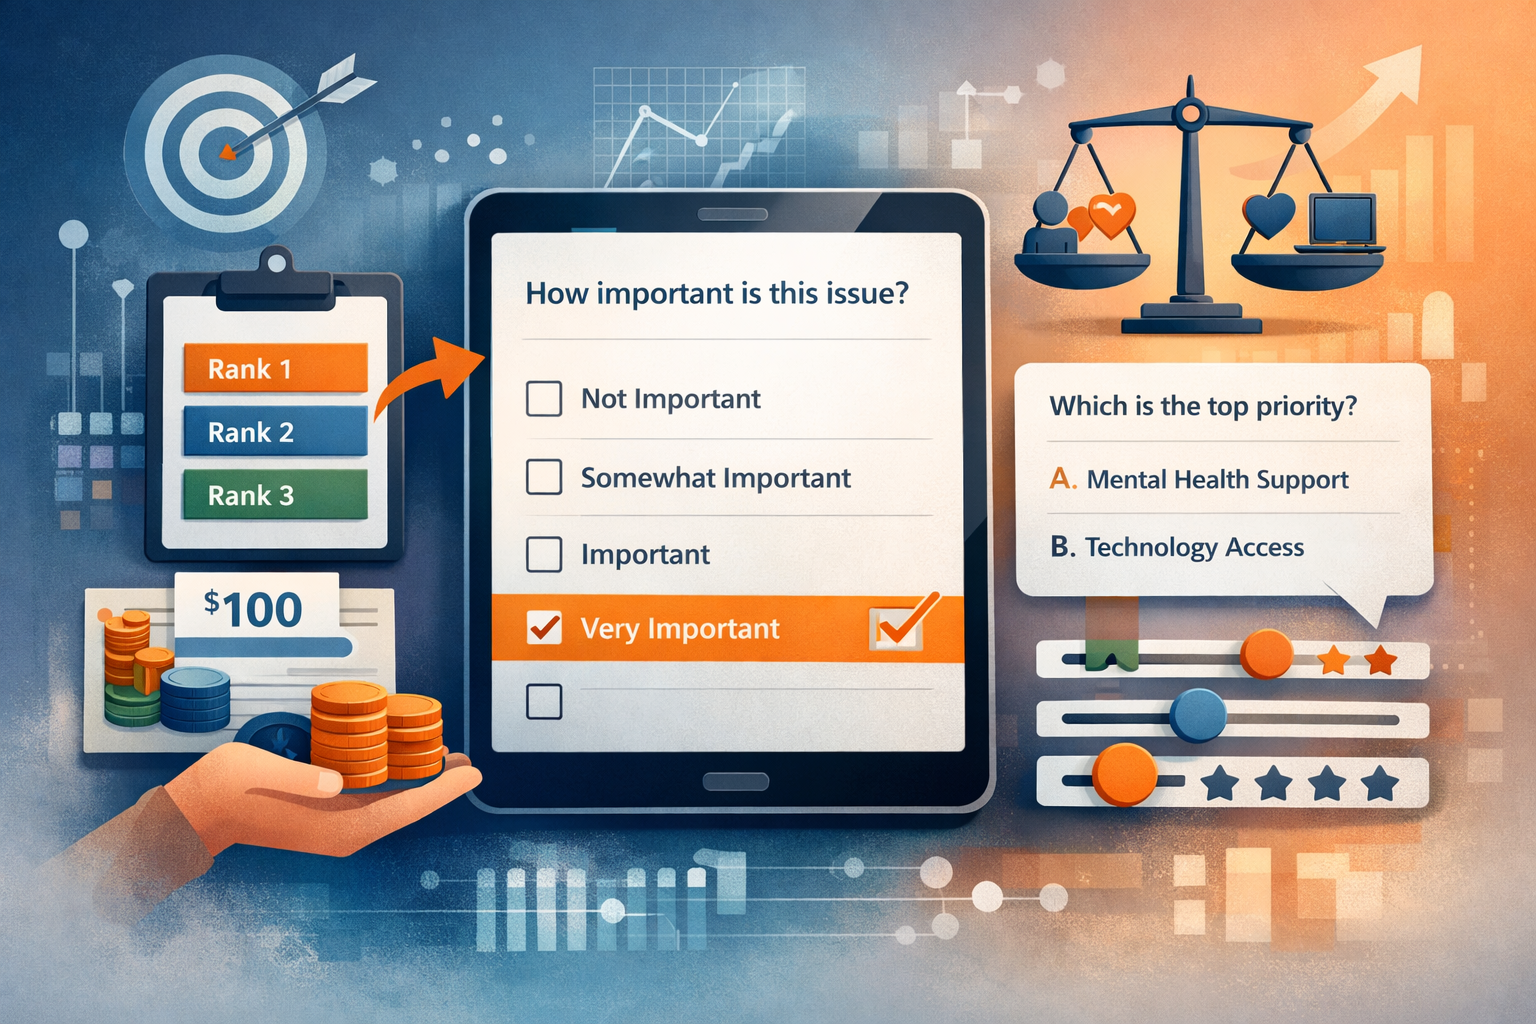
While conducting this review I came across a couple of surveys with very good items. However, I found a common issue across them: the survey response scale. The common denominator across surveys was the utilization of an importance response scale. This means that for every item in the survey, respondents would classify each from not important to very important. Let’s look at response scales first.
Every time we answer a survey, we are used to see a set of responses we are given to rate based on our opinion. Those scales are structured sets of answer options in an ordered way that are used in questionnaires to quantify constructs like attitudes, perceptions, or behaviors. They transform qualitative responses into systematic data for analysis and interpretation in educational research and psychometrics.
There are some very common scales we are used to:
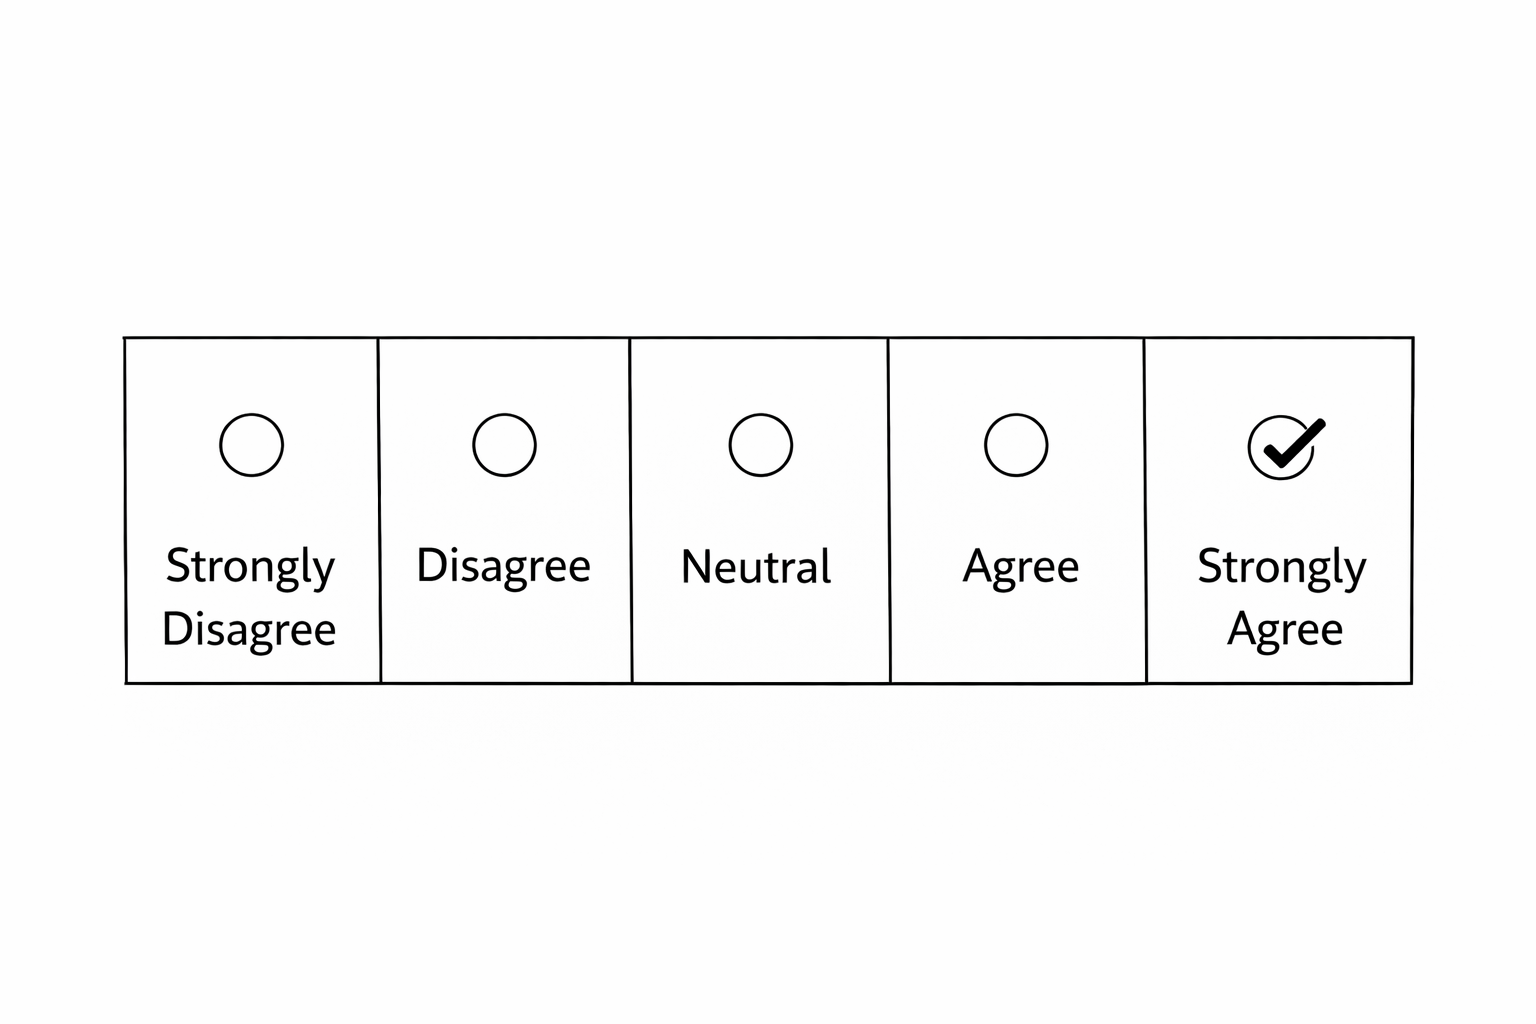
Agreement Scales
A response scale that captures the extent to which respondents agree or disagree with a statement, commonly ranging from strongly disagree to strongly agree.
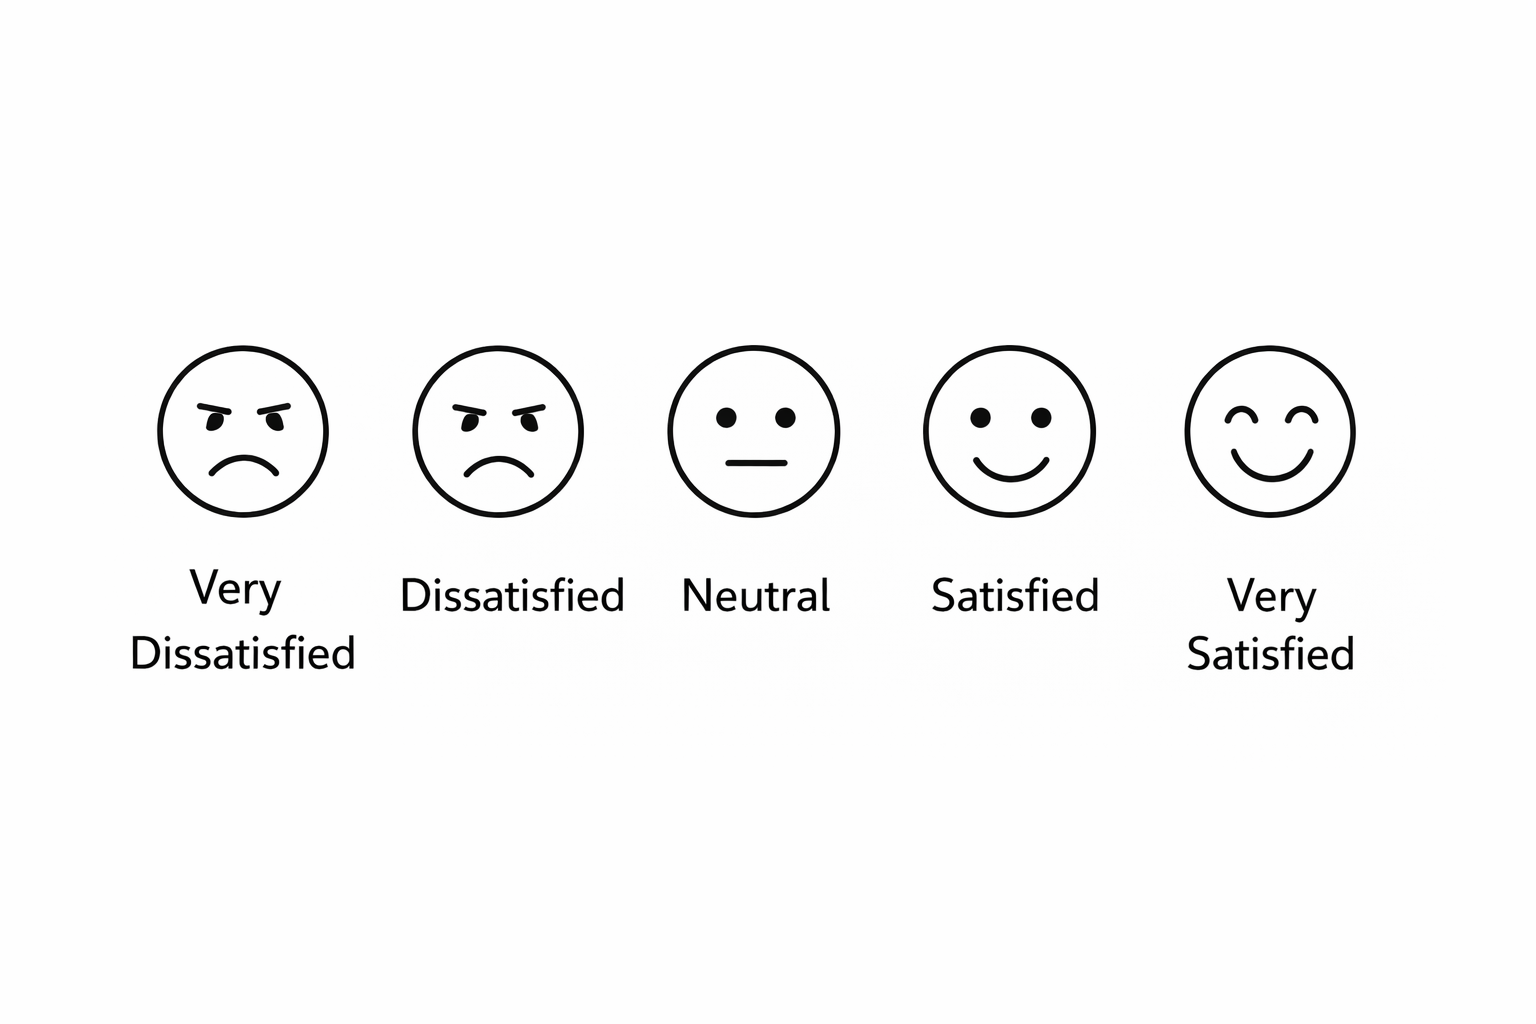
Satisfaction Scales
A response scale that measures how satisfied respondents are with a service, experience, or outcome, usually ranging from very dissatisfied to very satisfied.
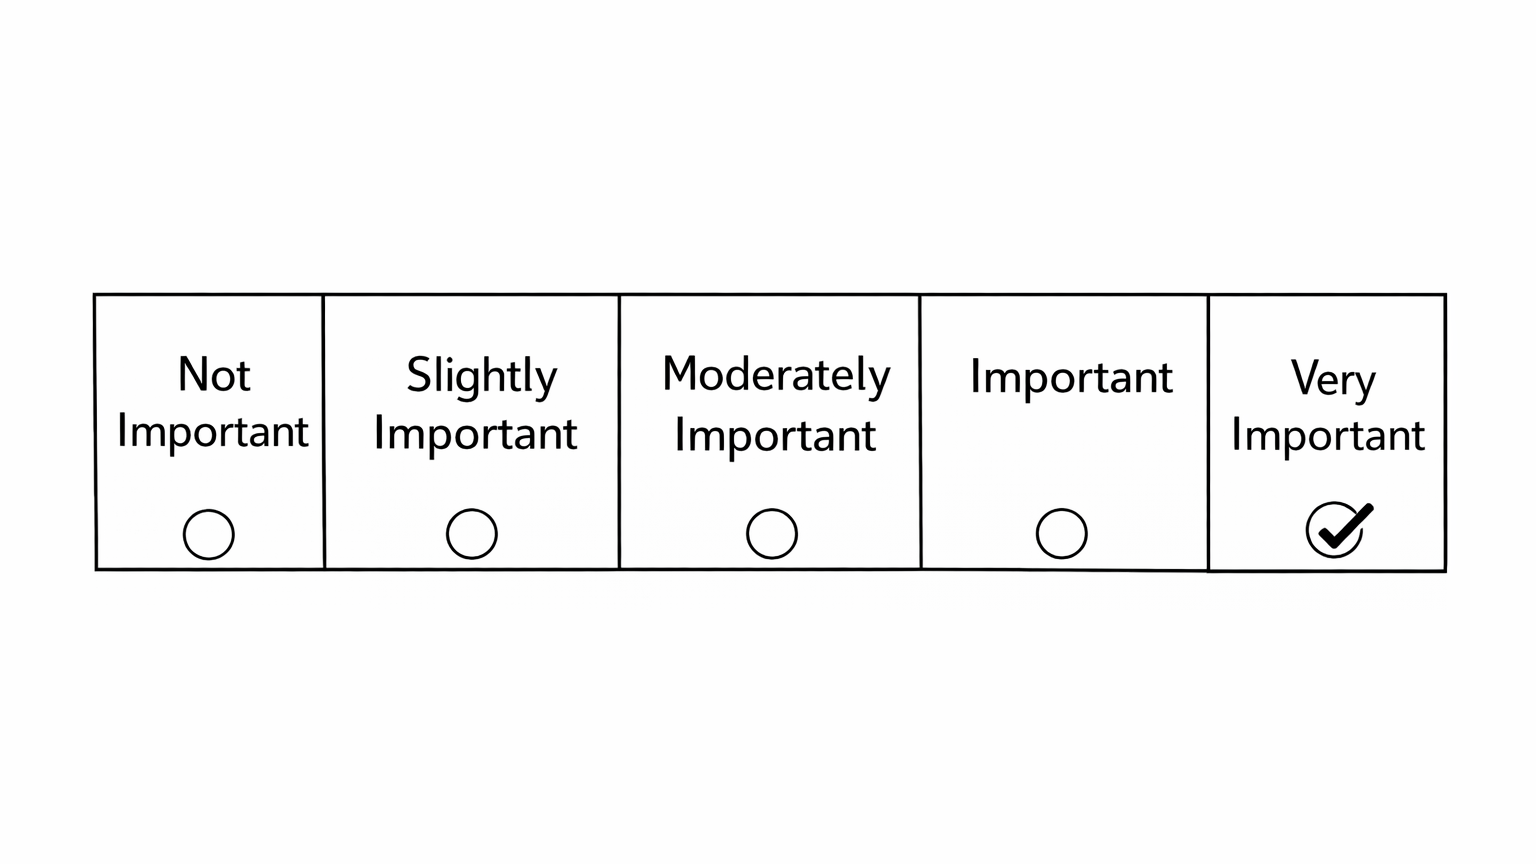
Importance Scales
A response scale that asks respondents to indicate how important each item is, typically ranging from not important to very important.
These response scales will determine how respondents interpret survey items. So, in a survey related to stakeholder input about how to prioritize federal funds, an importance response scale might be misleading. If I’m given a survey about how important is to fund staff, materials, devices, or supplies individually, I think they are all important. Probably many respondents are going to feel the same way and classify everything as important or very important. If we rate every educational need listed in the survey as “important” or “very important,” we create what measurement researchers call a restricted range. In other words, this means there is little variability in the responses and differentiation becomes almost impossible.
From a data analysis perspective, this creates three issues:
1. We cannot clearly distinguish between priorities.
2. The data appear affirming but are not decision-guiding.
3. We risk interpreting high ratings as urgency when they may simply reflect social desirability or general agreement.
The problem is not items themselves because we know that academic support, mental health services, technology access, or family engagement (to mention a few) are all important. But when it comes to making decisions for funding allocation, the scale must offer some sort of tradeoff.
When it comes to supplemental funding in education, we know those funds are limited but so are the resources, time in school and staff capacity. If every category receives an “important” and “very important” rating, decision-makers are left without direction. The data confirm that needs exist, but they do not clarify which needs require immediate attention or concentrated investment. The survey becomes symbolic rather than strategic, and program managers are back at the beginning, in the same reality before the survey was even distributed. This is the most important reason to carefully select response scales that are more suitable for decision making.
Now, if the goal is prioritization, the response structure must require some level of prioritization. There are several alternatives to a traditional importance scale:
• Forced ranking: Ask respondents to rank top three to five areas instead of rating each independently.
• Numerical ranking: group related items and ask the user to rank them on order of which must be funded first and latter.
• Max-difference style questions: Present small sets of options and ask which is most critical and least critical.
• Tiered urgency scales: Replace “important” with “critical for immediate investment,” “important but not urgent,” and “long-term consideration.”
• Budget allocation simulations: Give respondents a hypothetical $100 and ask them to distribute it across categories.
Each of these approaches introduces what we would call a constraint, and a constraint is the mechanism that produces differentiation. By using more constrained response scales, we are forcing respondents into differentiating from a set order of priorities. If we require respondents to choose, rank, or distribute limited resources, they shift from expressing agreement to exercising judgment.
In measurement terms, constrained formats increase variability and in governance terms, they generate clarity. In all, creating response scales forcing this recognition helps with prioritization in a responsible way. This does not mean that some needs are unimportant. It means that not all needs can be funded at the same level, at the same time, with the same urgency. If everything is a priority, then nothing really is; and sometimes, the most consequential decision in a survey is not the question we ask, but the response options we provide.
Some resources on survey response scales
1. Robie, C., Meade, A. W., Risavy, S. D., & Rasheed, S. (2022).
Effects of response option order on Likert-type psychometric properties and reactions. Educational and Psychological Measurement.
This article examines how different arrangements of response options (e.g., order of “strongly disagree” to “strongly agree”) affect psychometric characteristics of Likert-type measures.
Full text via PubMed Central: https://www.ncbi.nlm.nih.gov/pmc/articles/PMC9619315/
2. Abulela, M. A. A. (2024).
Does the number of response categories impact validity and reliability of Likert scales? SAGE Open.
Empirical investigation of how response alternative count (e.g., 5-point vs. 7-point) influences measurement properties such as validity and reliability.
Link to abstract and citation: https://journals.sagepub.com/doi/abs/10.1177/21582440241230363
3. Leung, S. O. (2011).
Psychometric Properties of Four 5-Point Likert Type Response Scales. Educational and Psychological Measurement.
Evaluation of psychometric characteristics of a common 5-point Likert response scale format used in educational research.
DOI/abstract: https://doi.org/10.1080/01488376.2011.580697
4. Jebb, A. T., et al. (2021).
A review of key Likert scale development advances. Frontiers in Psychology (peer-reviewed).
Although not specific to education, this review summarizes developments in constructing and validating Likert scales in psychological measurement; it draws on Educational and Psychological Measurement and other major journals.
Free access via PubMed Central: https://www.ncbi.nlm.nih.gov/pmc/articles/PMC8129175/