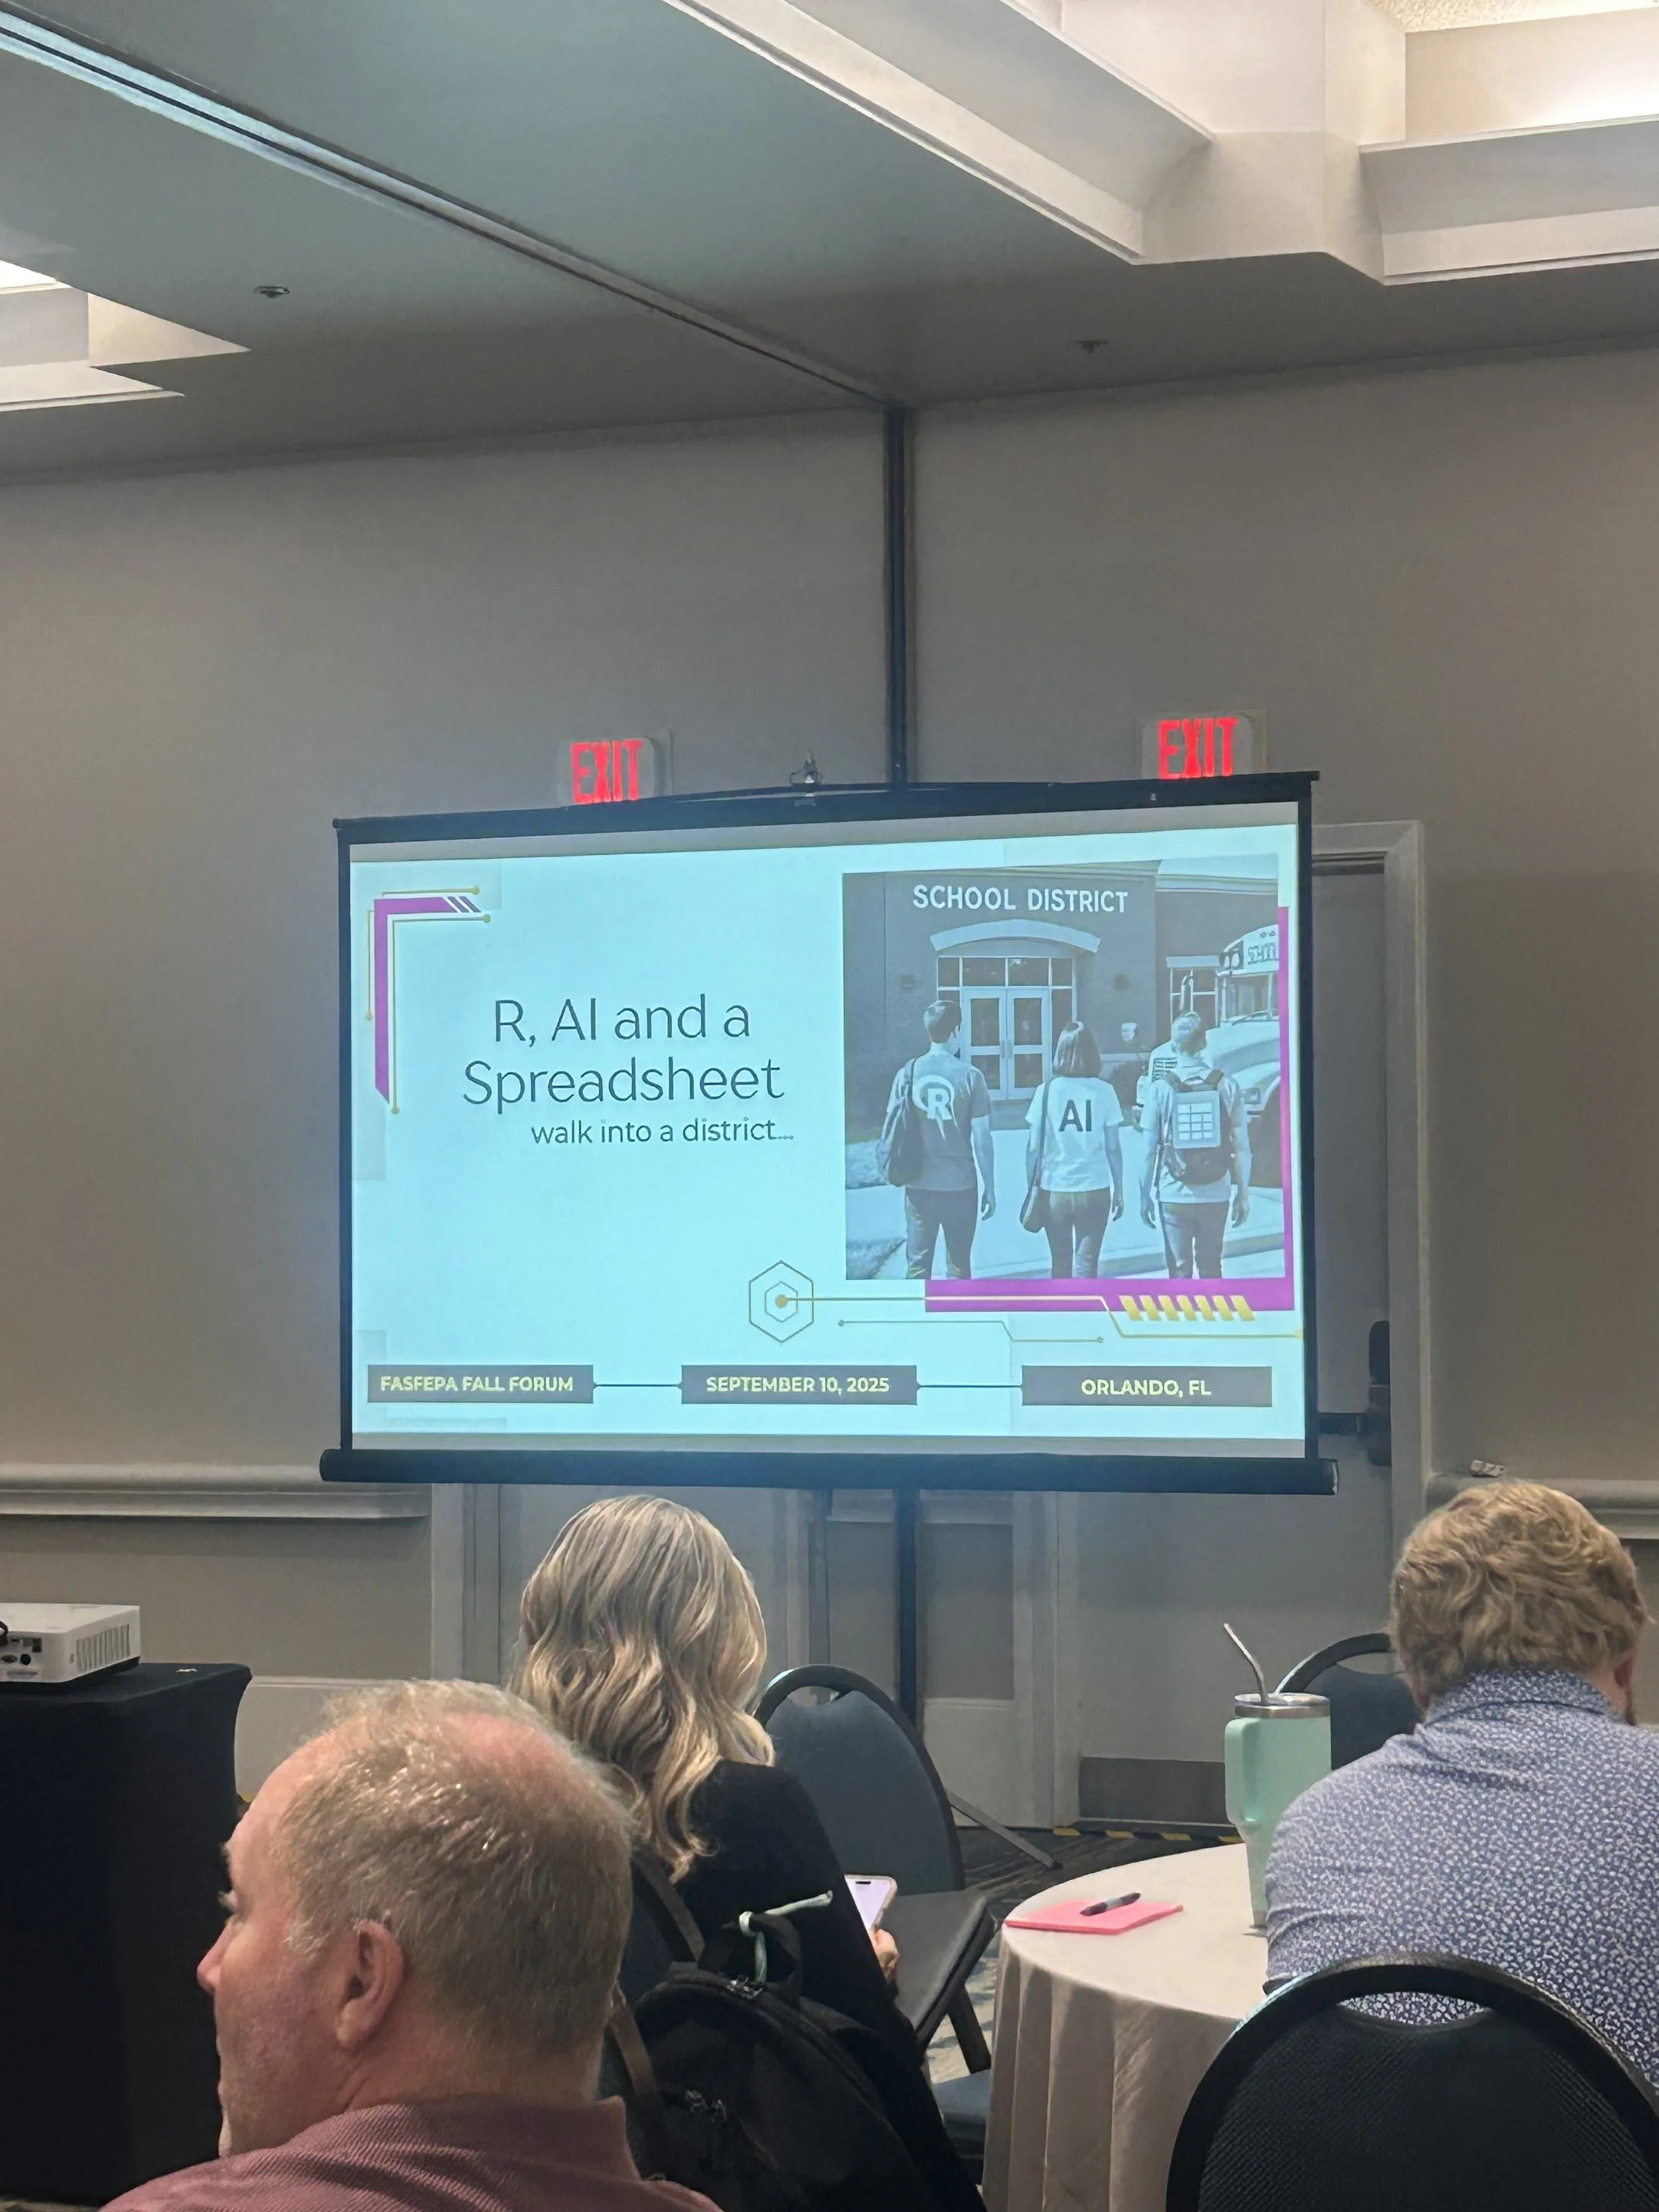
When AI, R, and a Spreadsheet Walked into FASFEPA…
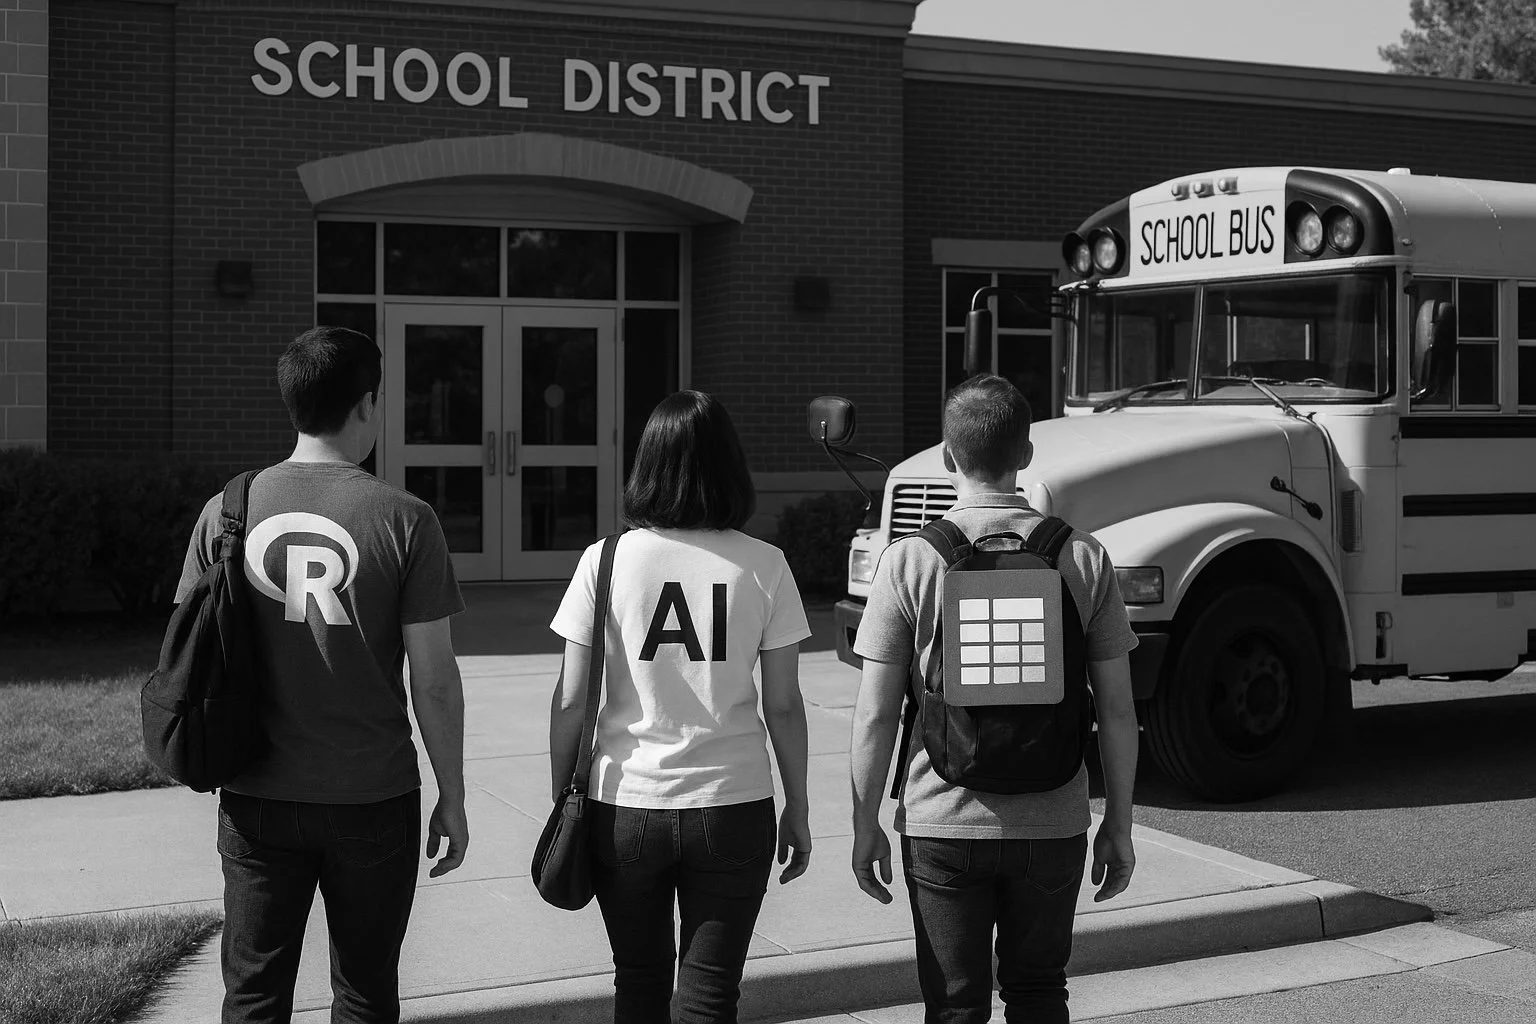
Earlier this fall, I had the opportunity to present one of my favorite sessions yet at the FASFEPA Fall Forum: “AI, R, and a Spreadsheet Walk into a District… and Evaluation Got Easier.” The title always earns a few smiles, and that’s intentional. Behind the humor is a real challenge that evaluators and federal program leaders face every day: how do we continue to produce high-quality evaluations when resources are shrinking? Budgets are tighter, expectations are higher, and districts are being asked to do more with less.
In many school districts, especially smaller ones, statistical software licenses can be prohibitively expensive. Platforms like SPSS, SAS, and Stata offer valuable features and user-friendly interfaces, but their costs often place them out of reach for programs operating under tight budgets. As a result, some districts rely entirely on spreadsheets — practical, familiar, and flexible, but limited when the analytical needs become more complex.
That’s where R comes in. R is a free, open-source environment for data analysis, modeling, and visualization, a powerful tool that can level the playing field for districts without access to costly software. Yet, R presents its own challenge: it’s a programming language. For many in education, that learning curve can feel intimidating.
I know this firsthand. When I was first introduced to R, I wanted nothing to do with it. As a student, I had access to SPSS, and that was enough for me. I vividly remember thinking that learning to code seemed unnecessary and time-consuming. A decade later, when SPSS wasn’t available, I found myself revisiting R, but this time, out of necessity. What once felt like an obstacle became an opportunity to learn just how powerful R really is. And recently, I discovered a way to bypass that learning curve.
At the FASFEPA (Federal Association of State and Federal Education Program Administrators) Conference, I wanted to do more than showcase R’s capabilities. I wanted to make it approachable. That’s where AI entered the picture.
By integrating AI into the workflow, evaluators can use it as a guide, a learning partner that helps write code, troubleshoot errors, and interpret outputs. AI doesn’t replace the evaluator; it supports them. It bridges the gap between knowing what analysis you want to run and having the confidence to run it independently.
During the presentation, I walked participants through live examples, showing how AI can assist step-by-step — from building a dataset to writing and understanding R scripts. The goal wasn’t to turn everyone into programmers overnight, but to show that you don’t have to be an expert to begin. Both sessions filled quickly, and the energy in the room was undeniable. Participants were curious, engaged, and genuinely excited about the possibilities. Several shared that they planned to experiment with R and AI when they returned to their districts, and that enthusiasm was contagious.
For me, the session was about more than tools, it was about access. Evaluation shouldn’t depend on whether a district can afford a license; it should depend on curiosity, creativity, and a willingness to learn. By combining R, AI, and even the familiar spreadsheet, evaluators can design cost-effective, scalable systems that meet real-world needs.
As I left the conference, I felt encouraged by how ready the field is to embrace new approaches. Seeing colleagues eager to explore, test, and build reminded me why I love this work. The path forward may require learning something new, but it’s one that makes evaluation more accessible, equitable, and sustainable — and that’s a change worth making.